
React Debugger

Debug React in DevTools: perf, memory & anti‑patterns
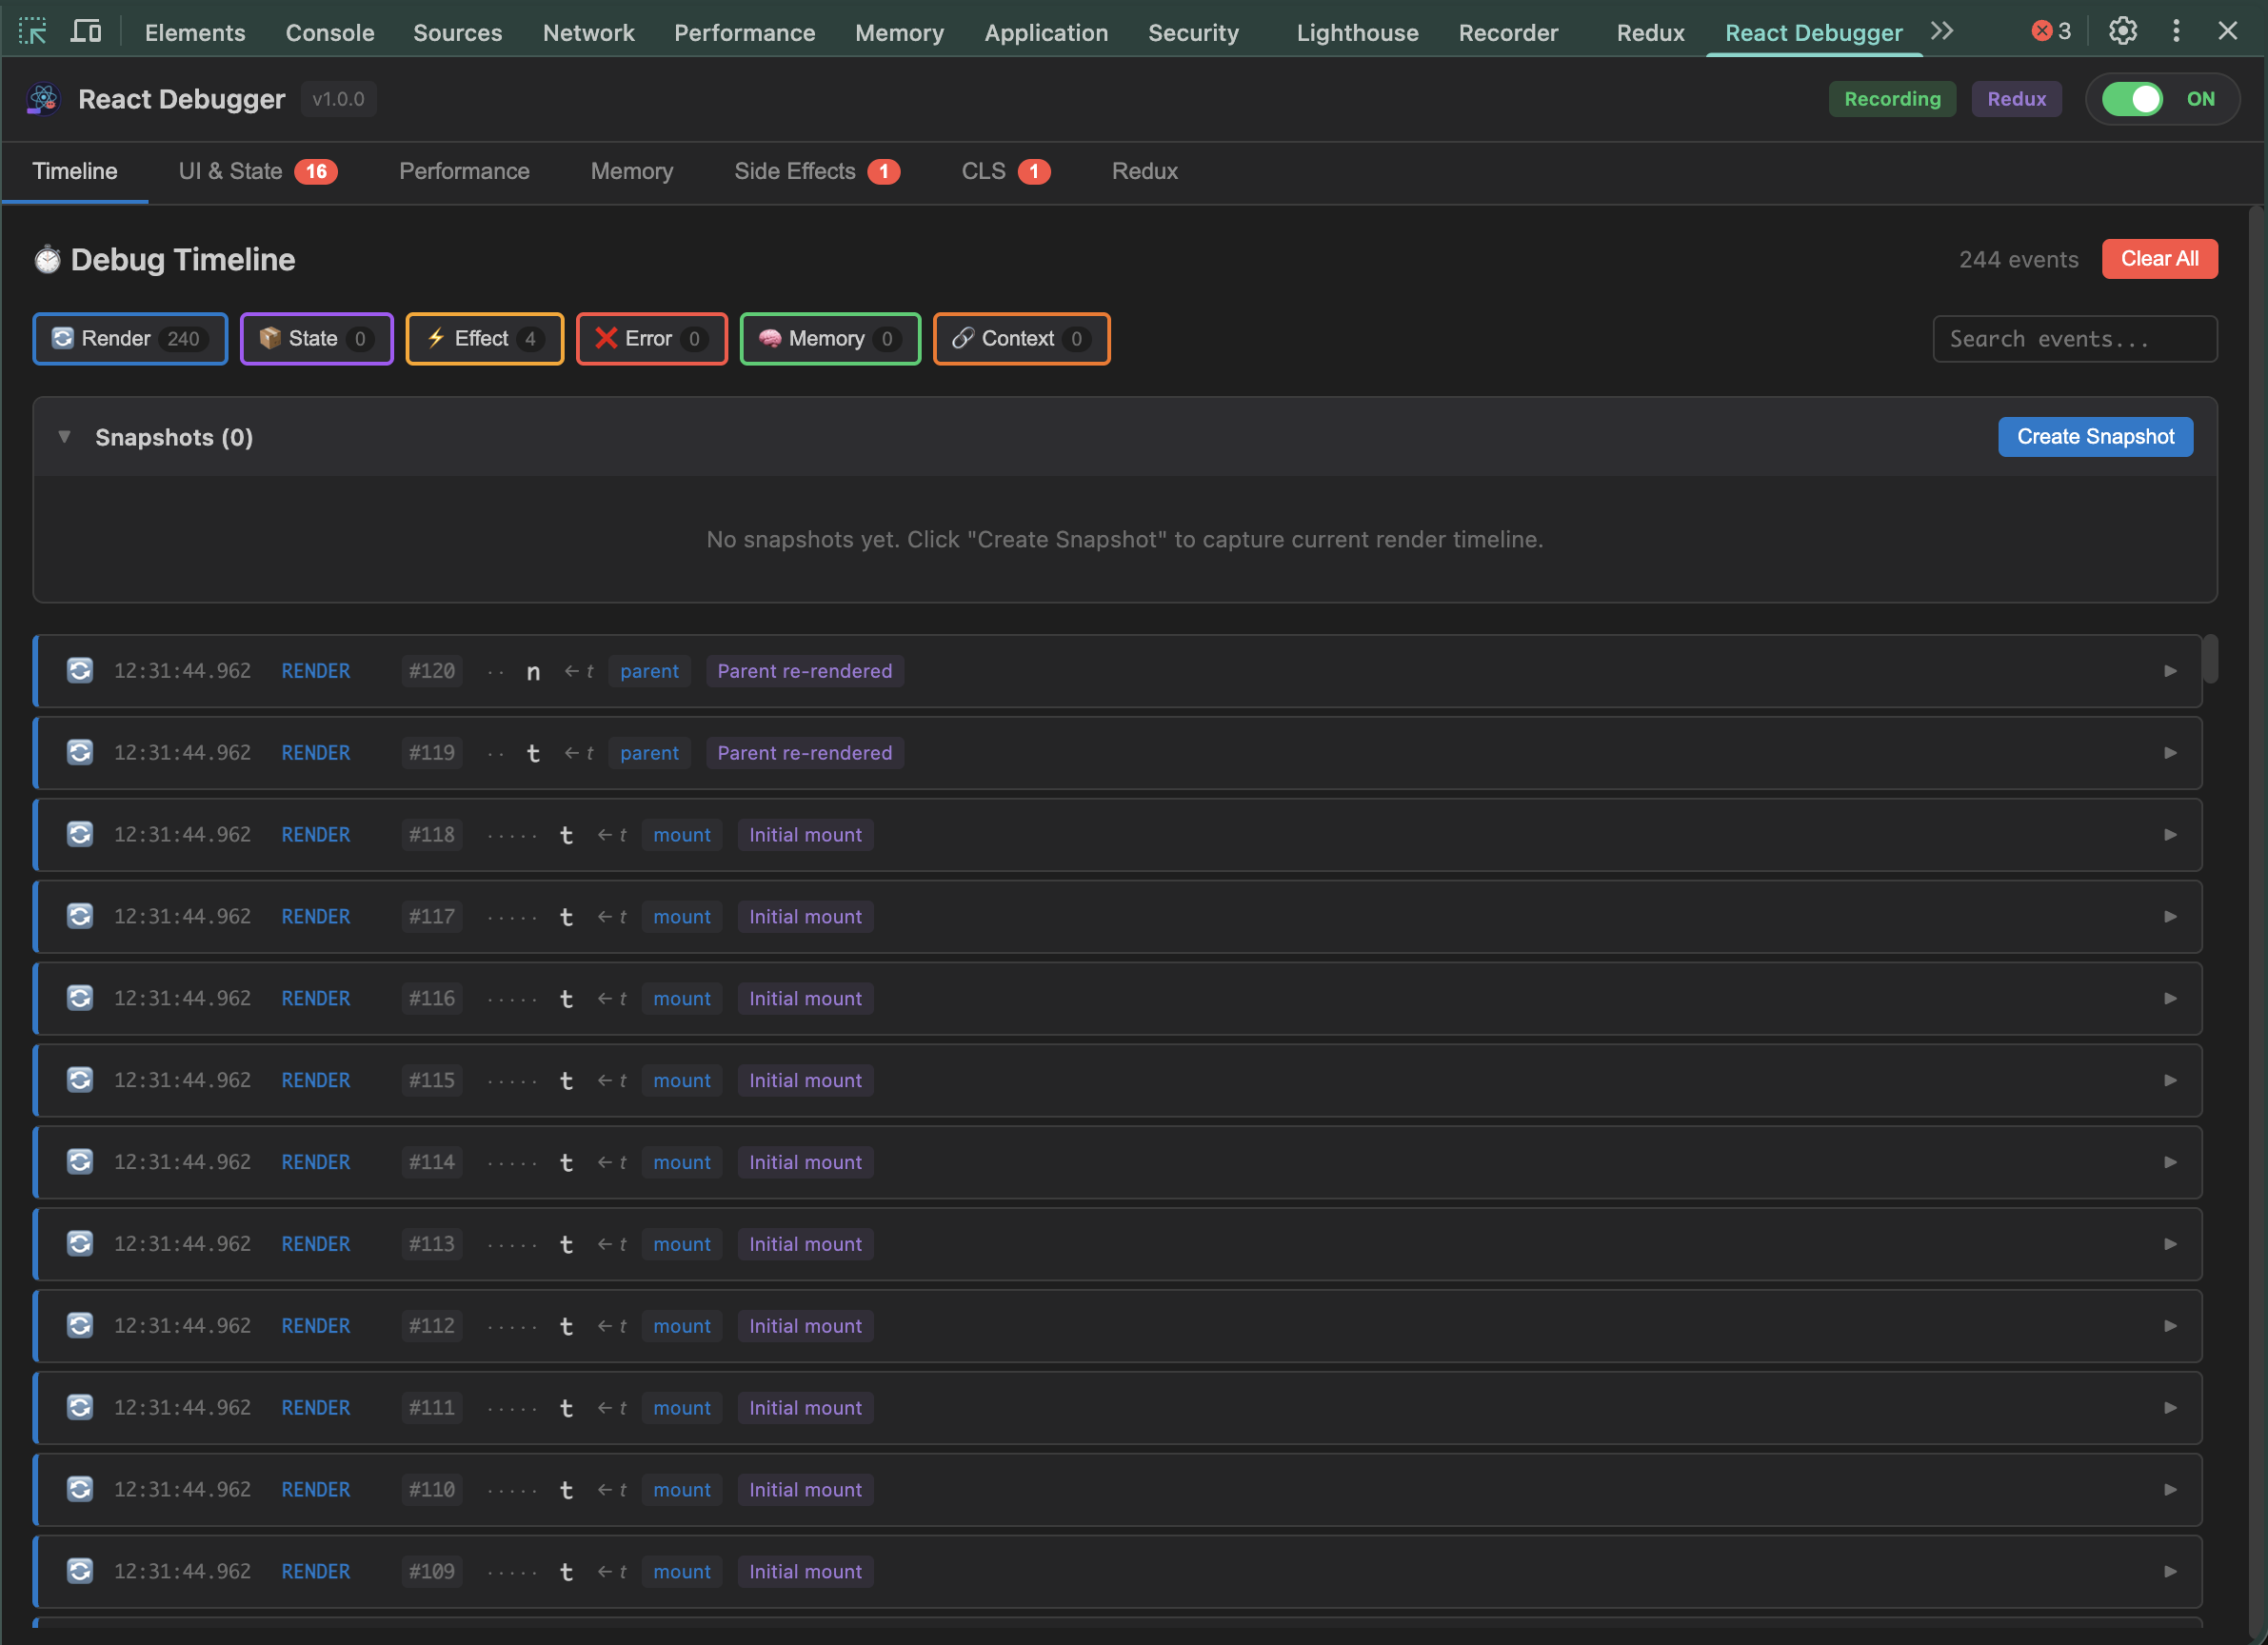
React Debugger – Integrated React performance, memory, and anti-pattern analysis in DevTools
Summary: React Debugger is a Chrome DevTools extension that consolidates React performance profiling, memory monitoring, anti-pattern detection, Side Effects and CLS insights, plus Redux debugging into a single panel. It enables developers to identify render issues, memory leaks, and effect bugs without extra code.
What it does
It profiles render counts, durations, and triggers, tracks memory growth, detects common anti-patterns, inspects Side Effects and Cumulative Layout Shift, and provides Redux time-travel and live state editing.
Who it's for
React developers needing comprehensive debugging tools within Chrome DevTools to diagnose performance and state management issues.
Why it matters
It reduces time spent hunting React performance problems, memory leaks, and subtle effect bugs by combining key diagnostics in one interface.