
JIRA Epic Planning Dashboard

The local-first, lightning-fast Gantt chart for JIRA.
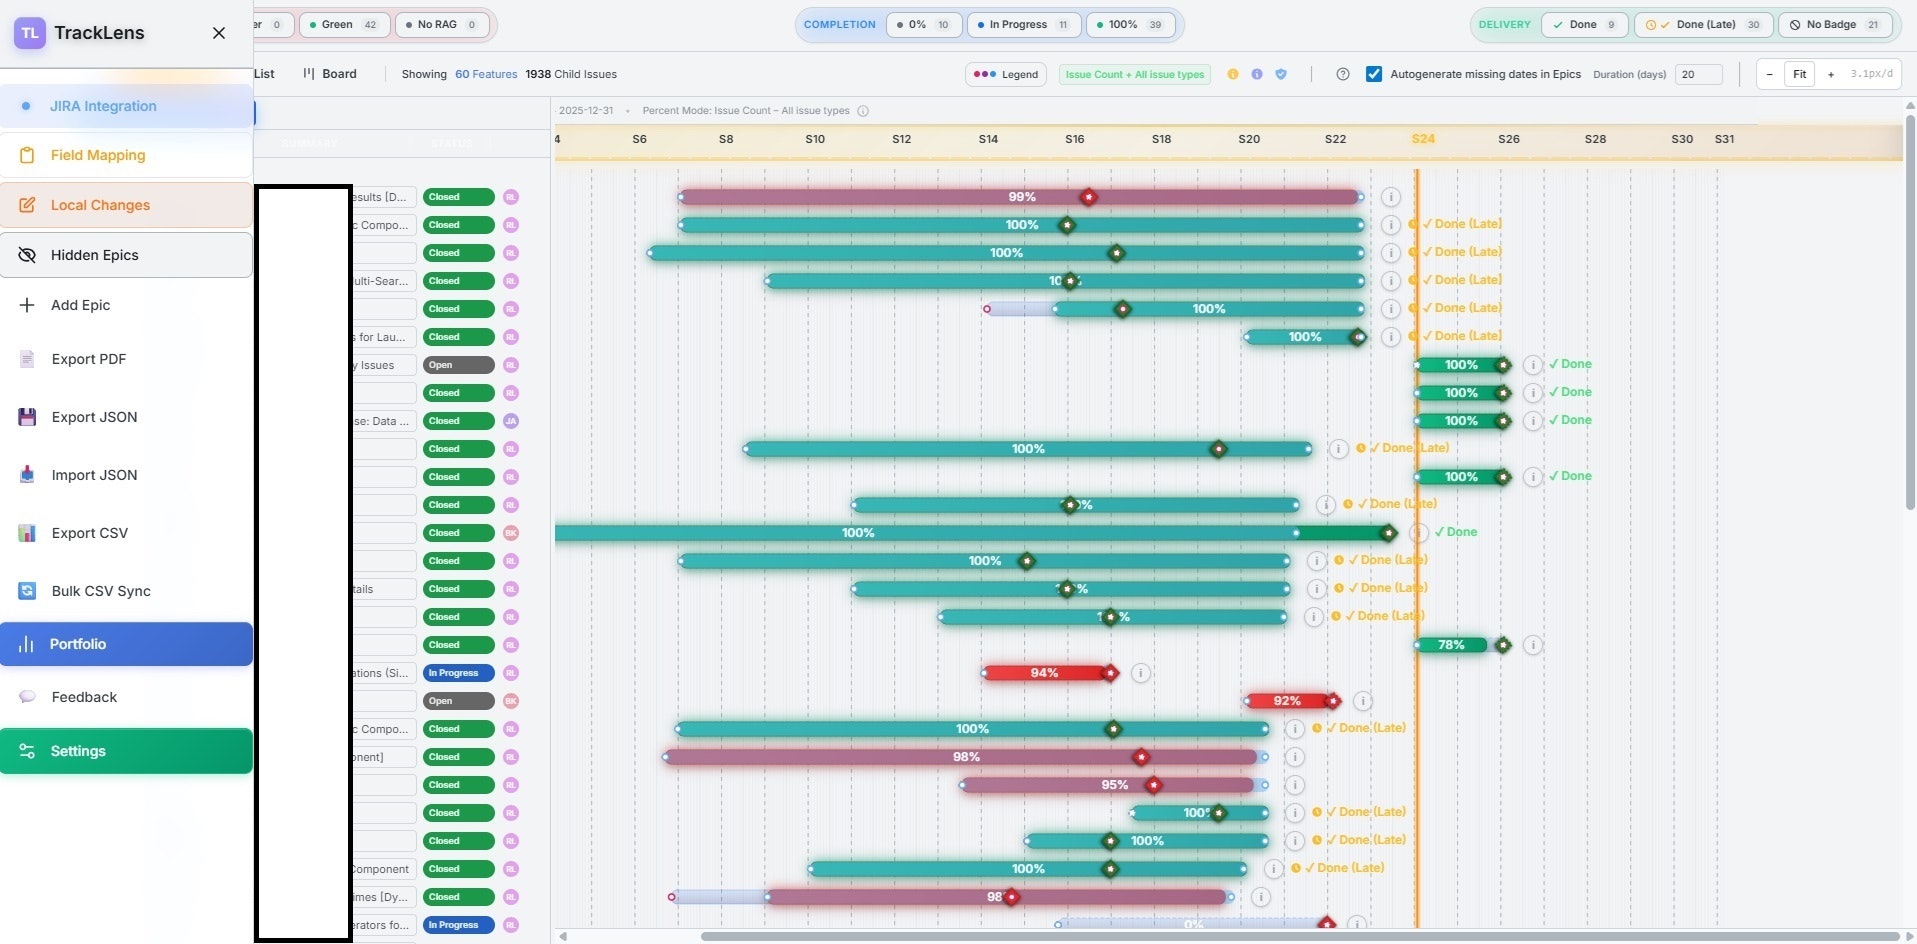
JIRA Epic Planning Dashboard – Local-first, real-time Gantt chart for JIRA
Summary: JIRA Epic Planning Dashboard is a local-first tool that pulls Epic data from JIRA to provide an instant, interactive Gantt chart with smart date inference and built-in risk indicators. It enhances JIRA’s roadmap visualization by offering real-time performance and privacy without replacing the JIRA database.
What it does
The tool imports Epics from JIRA into local browser storage, enabling zero-latency interaction with a Gantt chart that supports zooming, filtering, and editing. It infers missing start or end dates from child issues and calculates Red-Amber-Green (RAG) status for each Epic to indicate project health.
Who it's for
It is designed for Product Managers and Technical Leads managing complex roadmaps who need a faster, clearer visualization of JIRA data without relying on slow native roadmaps or costly plugins.
Why it matters
It solves the problem of JIRA’s limited and slow roadmap views by providing a responsive, privacy-focused interface that maintains a live connection to JIRA while keeping data local and secure.