
iPlotCSV

Leave Python and Excel out of it
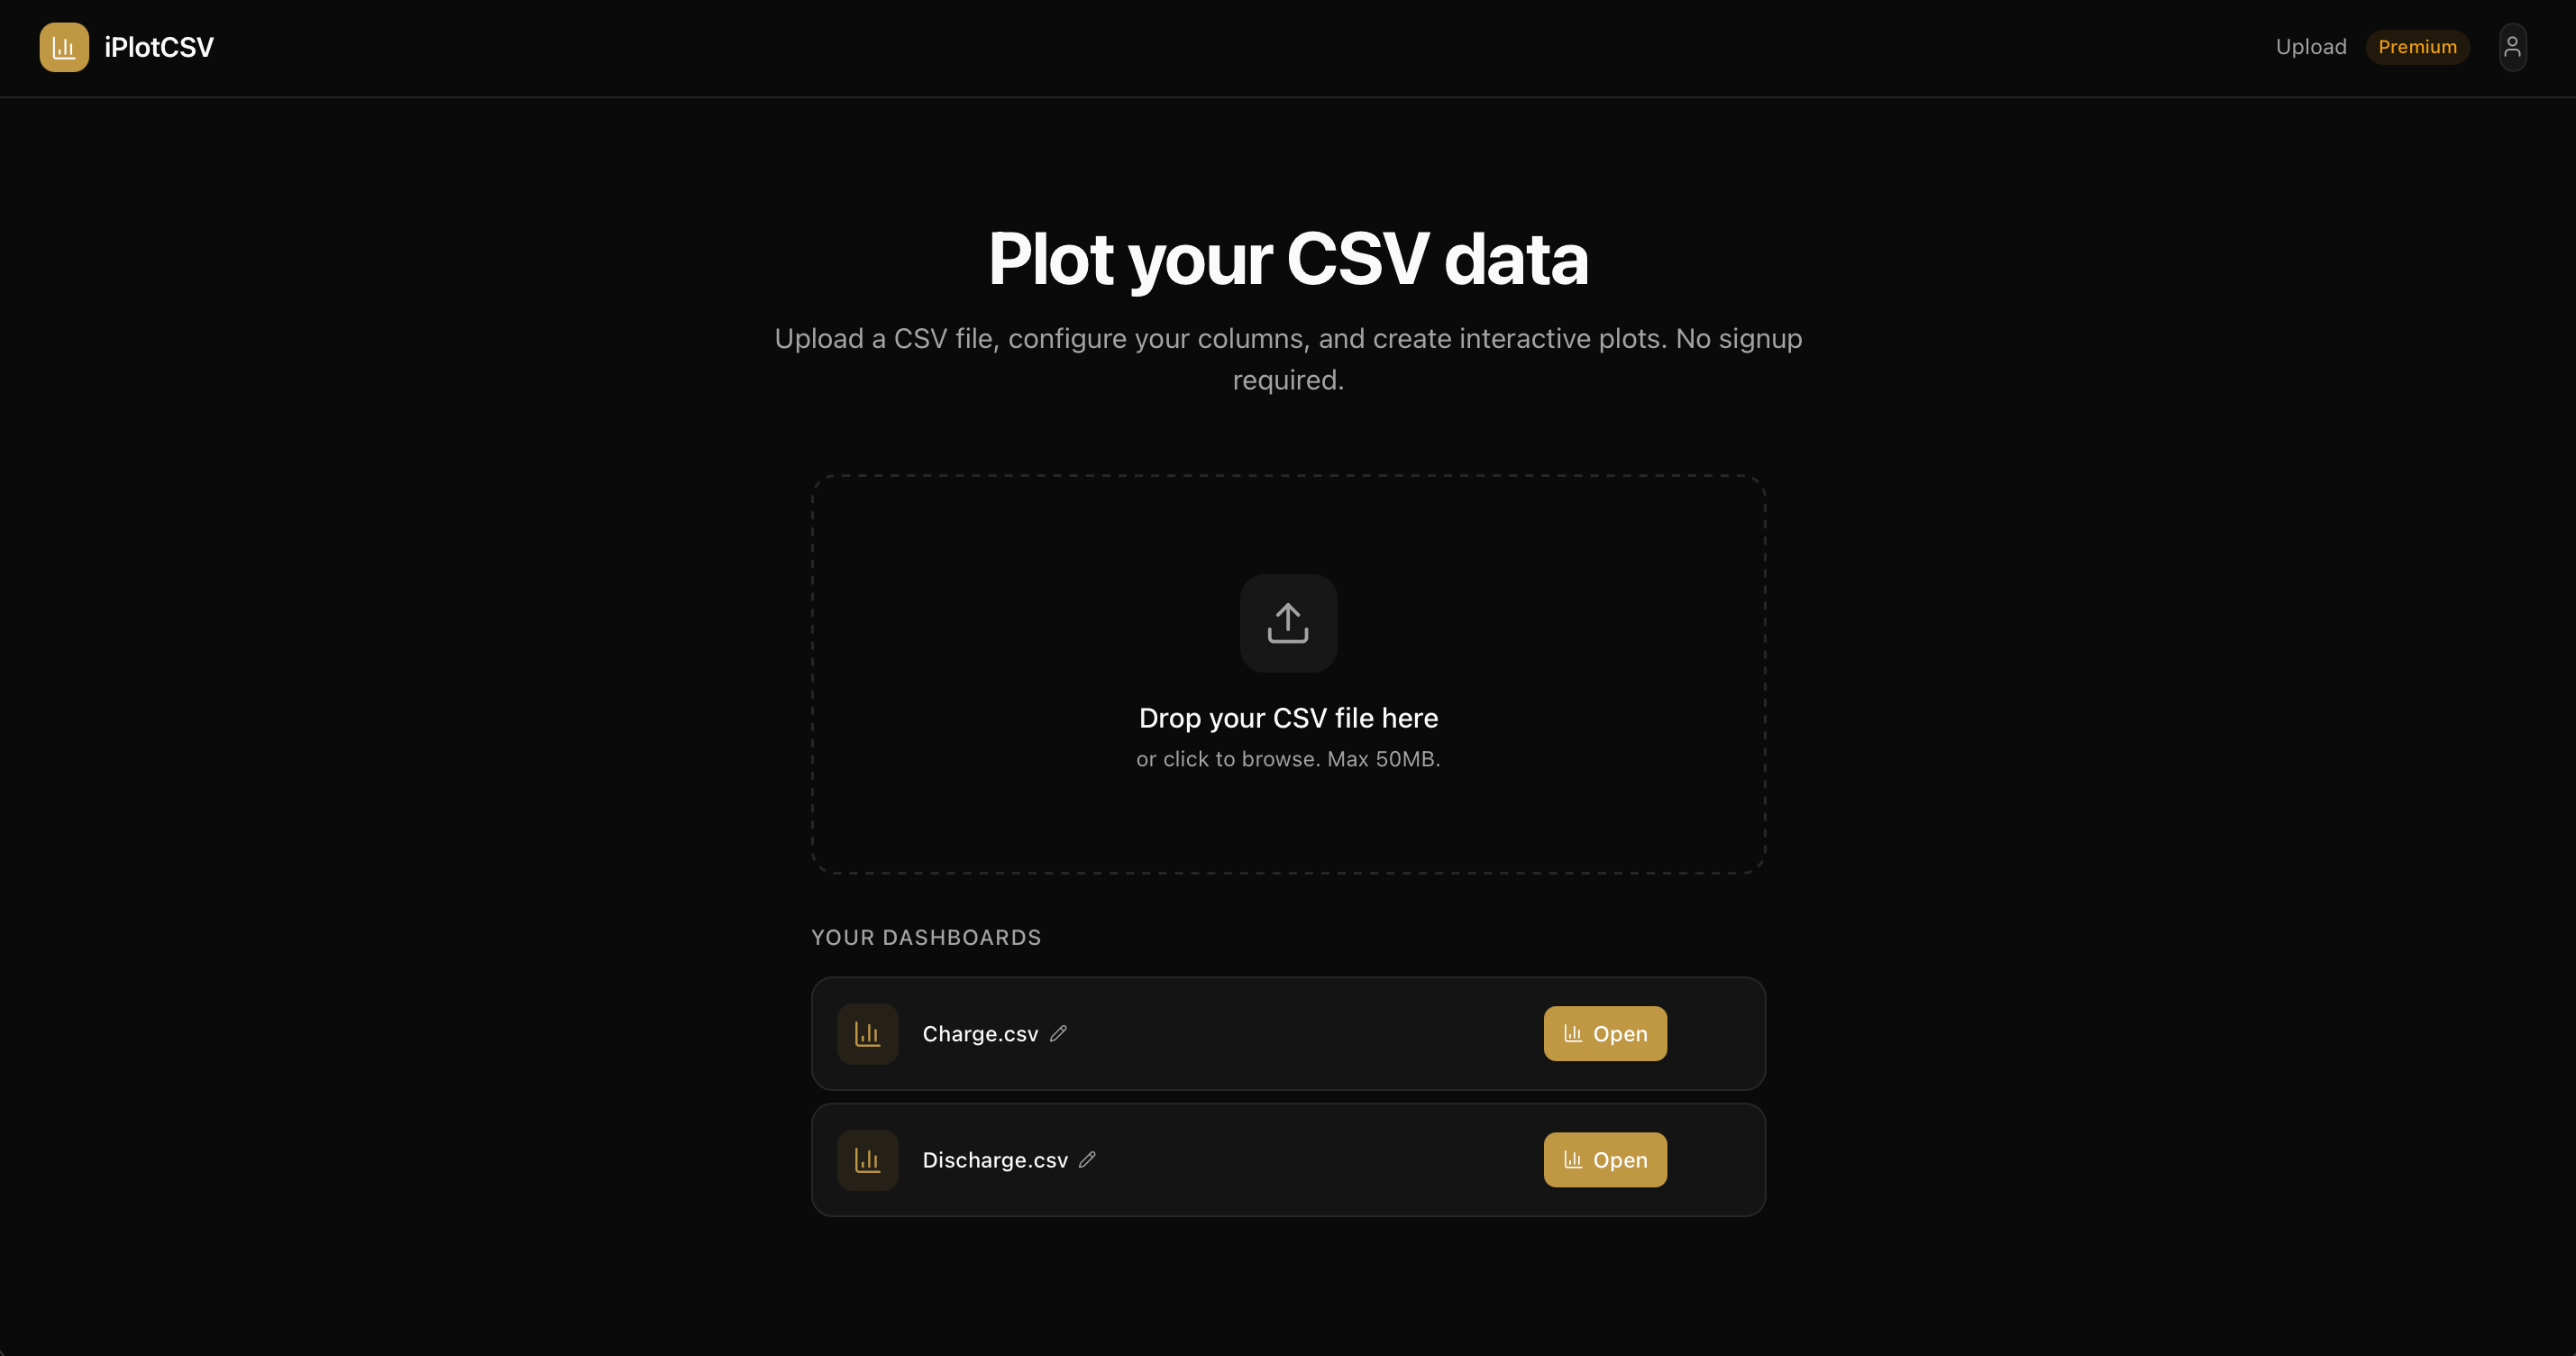
iPlotCSV – Visualize CSV data without Python or Excel
Summary: iPlotCSV is a web tool that creates interactive charts directly from CSV files without requiring installation, signup, or coding. Users upload their data, select columns, and instantly generate visualizations, streamlining the process of analyzing CSV data.
What it does
It allows users to drop CSV files, choose columns, and produce interactive charts in a browser. Features include multi-file overlays and calculated columns for comparing datasets and performing basic data transformations without external tools.
Who it's for
It targets users who handle test data, sensor logs, or performance CSVs and need quick visualization without scripting or spreadsheet software.
Why it matters
It eliminates the time-consuming steps of coding or spreadsheet manipulation, enabling faster insight into CSV data through immediate, interactive charts.