
Heat Globe

Explore live global data on an interactive 3D Earth.
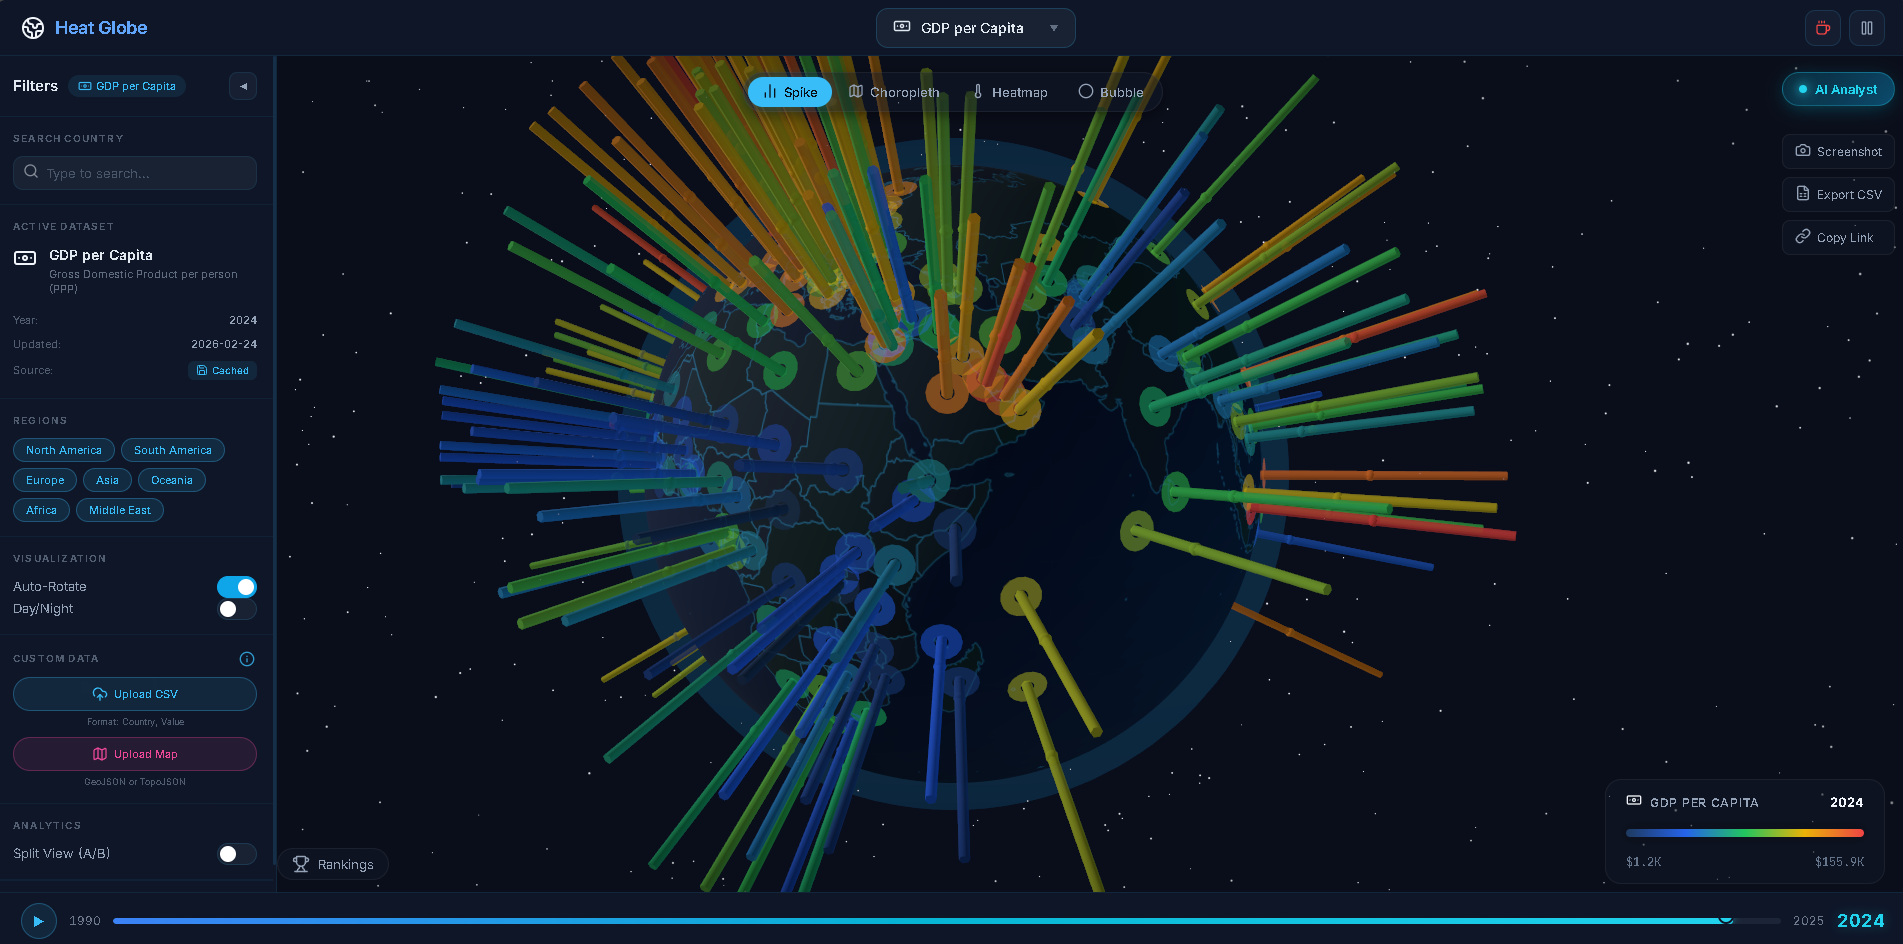
Heat Globe – Interactive 3D visualization of live and historical global data
Summary: Heat Globe is a browser-based 3D Earth visualization platform that maps live events and historical datasets at 60fps. It supports heatmaps, population spikes, and split-screen metric comparisons, enhanced by an integrated AI Analyst for contextual insights.
What it does
Heat Globe renders complex global data such as ISS tracking, GDP, and climate metrics onto a 3D WebGL Earth using Next.js and React Three Fiber. Users can switch between real-time and historical data, view multiple metrics simultaneously, and receive AI-generated explanations for selected data points.
Who it's for
It is designed for users needing spatial context to analyze global phenomena like climate shifts, population density, or live event tracking directly in the browser without login.
Why it matters
Heat Globe addresses the limitations of traditional 2D maps and spreadsheets by providing an accurate, interactive 3D spatial representation that improves understanding of complex global data relationships.