
FlowMap

See through trading charts like X-ray.
FlowMap – Advanced orderflow visualization for TradingView
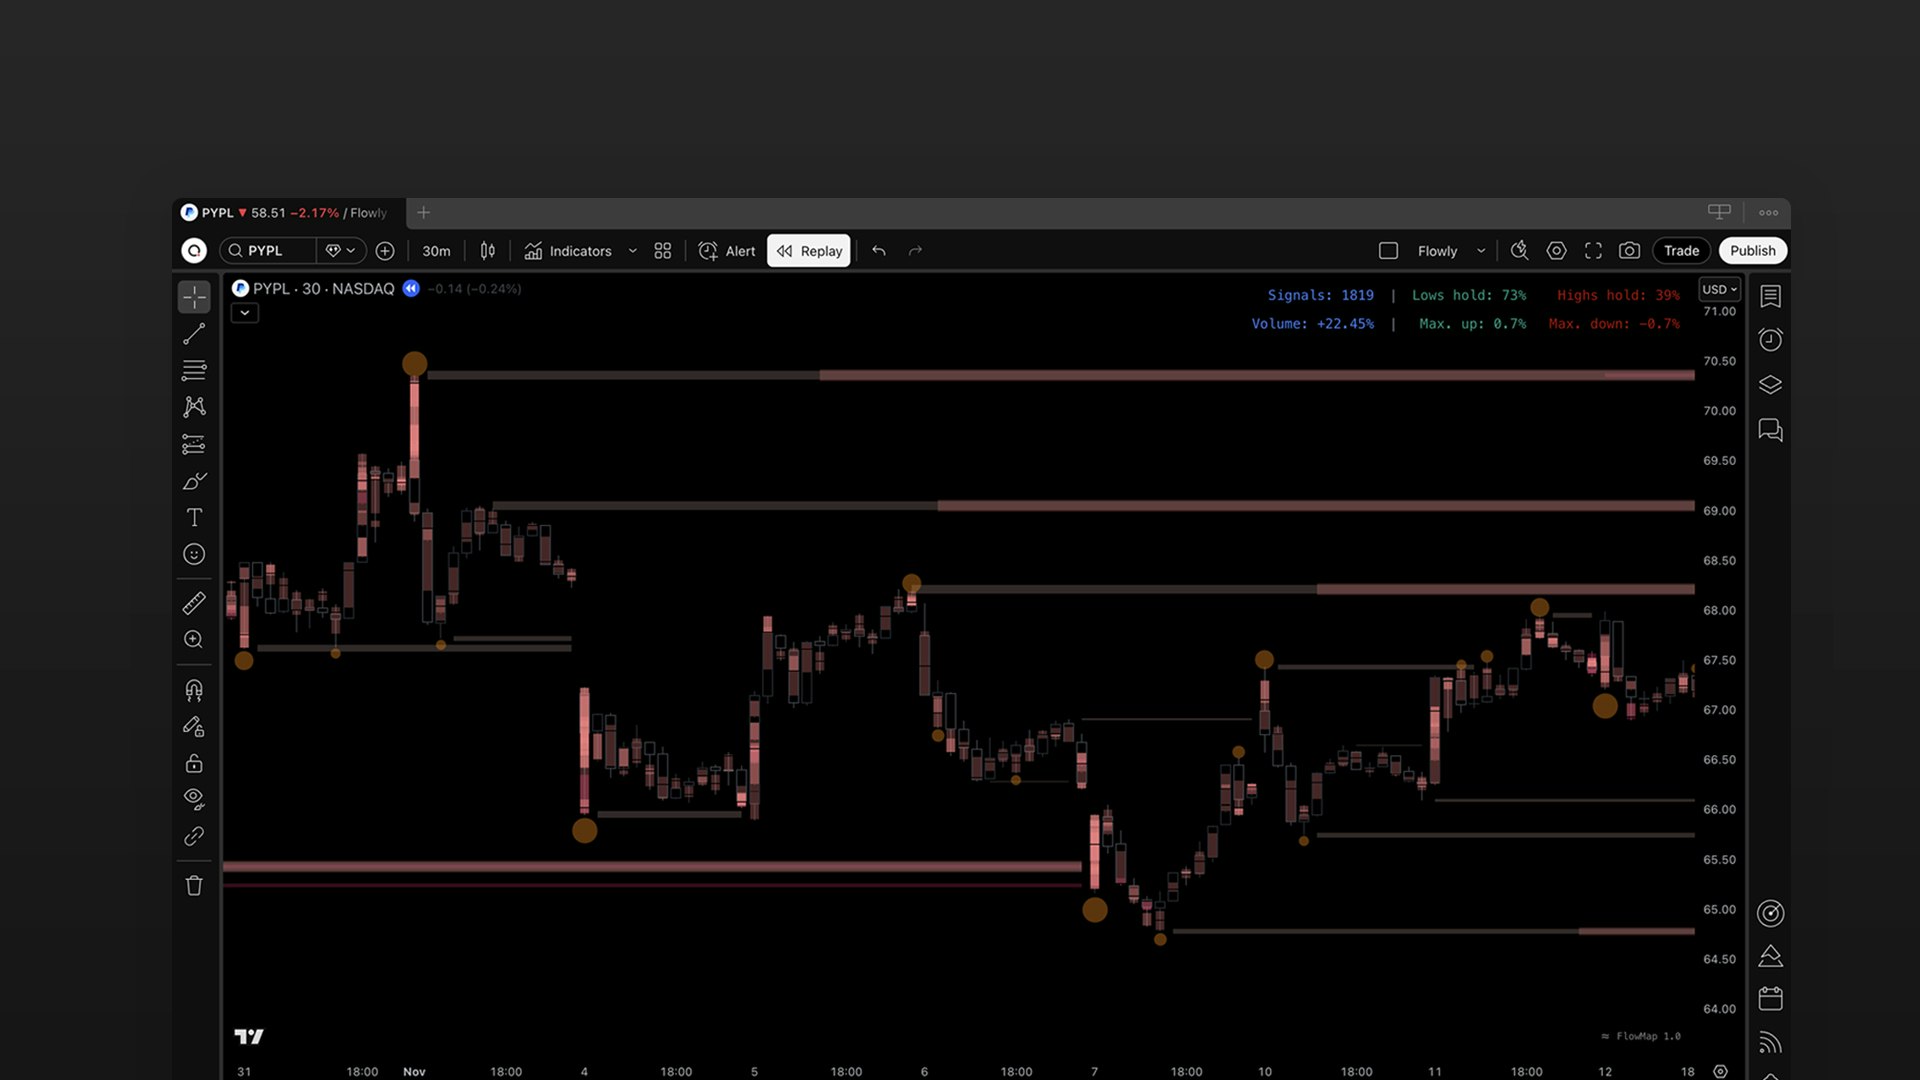
Summary: FlowMap is an orderflow tool integrated with TradingView that visualizes liquidity, trapped traders, unusual volume, and key market statistics. It features a liquidity heatmap, value area, point of control, liquidation bubbles, and custom orderflow signals to analyze price and volume data across multiple markets simultaneously.
What it does
FlowMap overlays advanced orderflow indicators on TradingView charts, enabling users to detect stop-loss triggers, trade executions, buy and sell orders, and whale activity. It supports custom signals, automated alerts, and scanning of hundreds of markets for data-driven insights.
Who it's for
Traders and analysts seeking detailed orderflow data and multi-market scanning within TradingView.
Why it matters
It simplifies complex orderflow analysis by providing real-time visualization and automated scanning without requiring additional data feeds or extensive configuration.