
CompoundChart

Visual compound interest for complex, multi-asset portfolios
#User Experience
#Fintech
#Investing
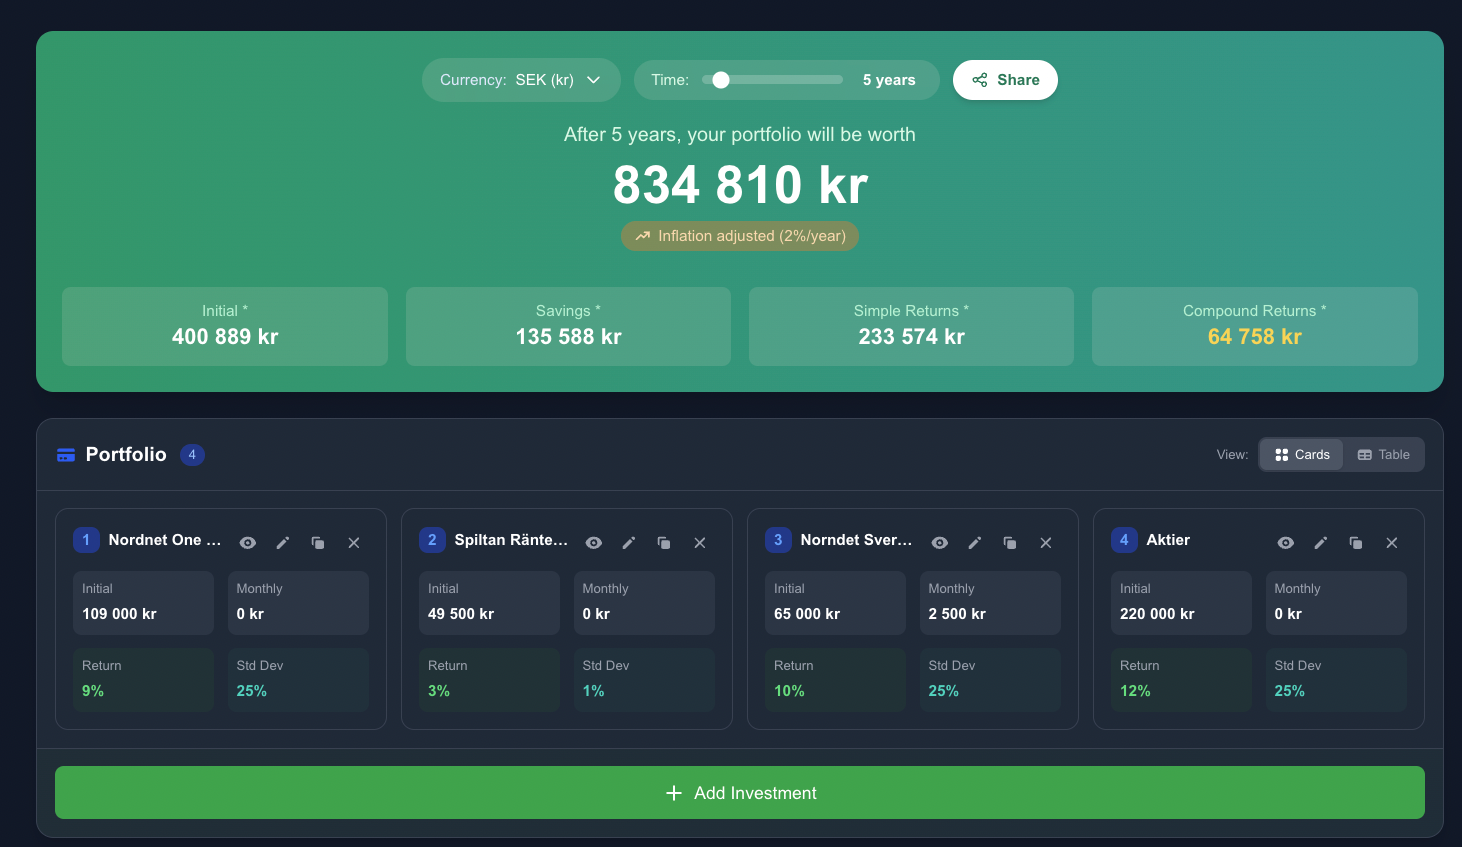
CompoundChart – Visual compound interest for multi-asset portfolios
Summary: CompoundChart is a free interactive calculator that visualizes investment growth using stacked charts. It supports multiple investments, withdrawal planning, and retirement savings calculations, highlighting compound interest effects over time.
What it does
It allows users to add multiple investments to a portfolio, plan withdrawals, and track growth with visual stacked charts, incorporating factors like standard deviation.
Who it's for
Investors and planners managing complex, multi-asset portfolios who want to analyze compound interest and portfolio growth.
Why it matters
It solves the challenge of visualizing and managing compound interest across multiple investments in one interactive tool.